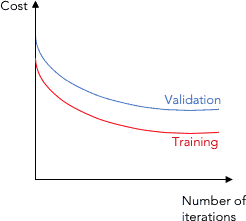
In machine learning (ML), a learning curve (or training curve) is a graphical representation that shows how a model's performance on a training set (and usually a validation set) changes with the number of training iterations (epochs) or the amount of training data. Typically, the number of training epochs or training set size is plotted on the x-axis, and the value of the loss function (and possibly some other metric such as the cross-validation score) on the y-axis.
Synonyms include error curve, experience curve, improvement curve and generalization curve.
More abstractly, learning curves plot the difference between learning effort and predictive performance, where "learning effort" usually means the number of training samples, and "predictive performance" means accuracy on testing samples.
Learning curves have many useful purposes in ML, including:
- choosing model parameters during design,
- adjusting optimization to improve convergence,
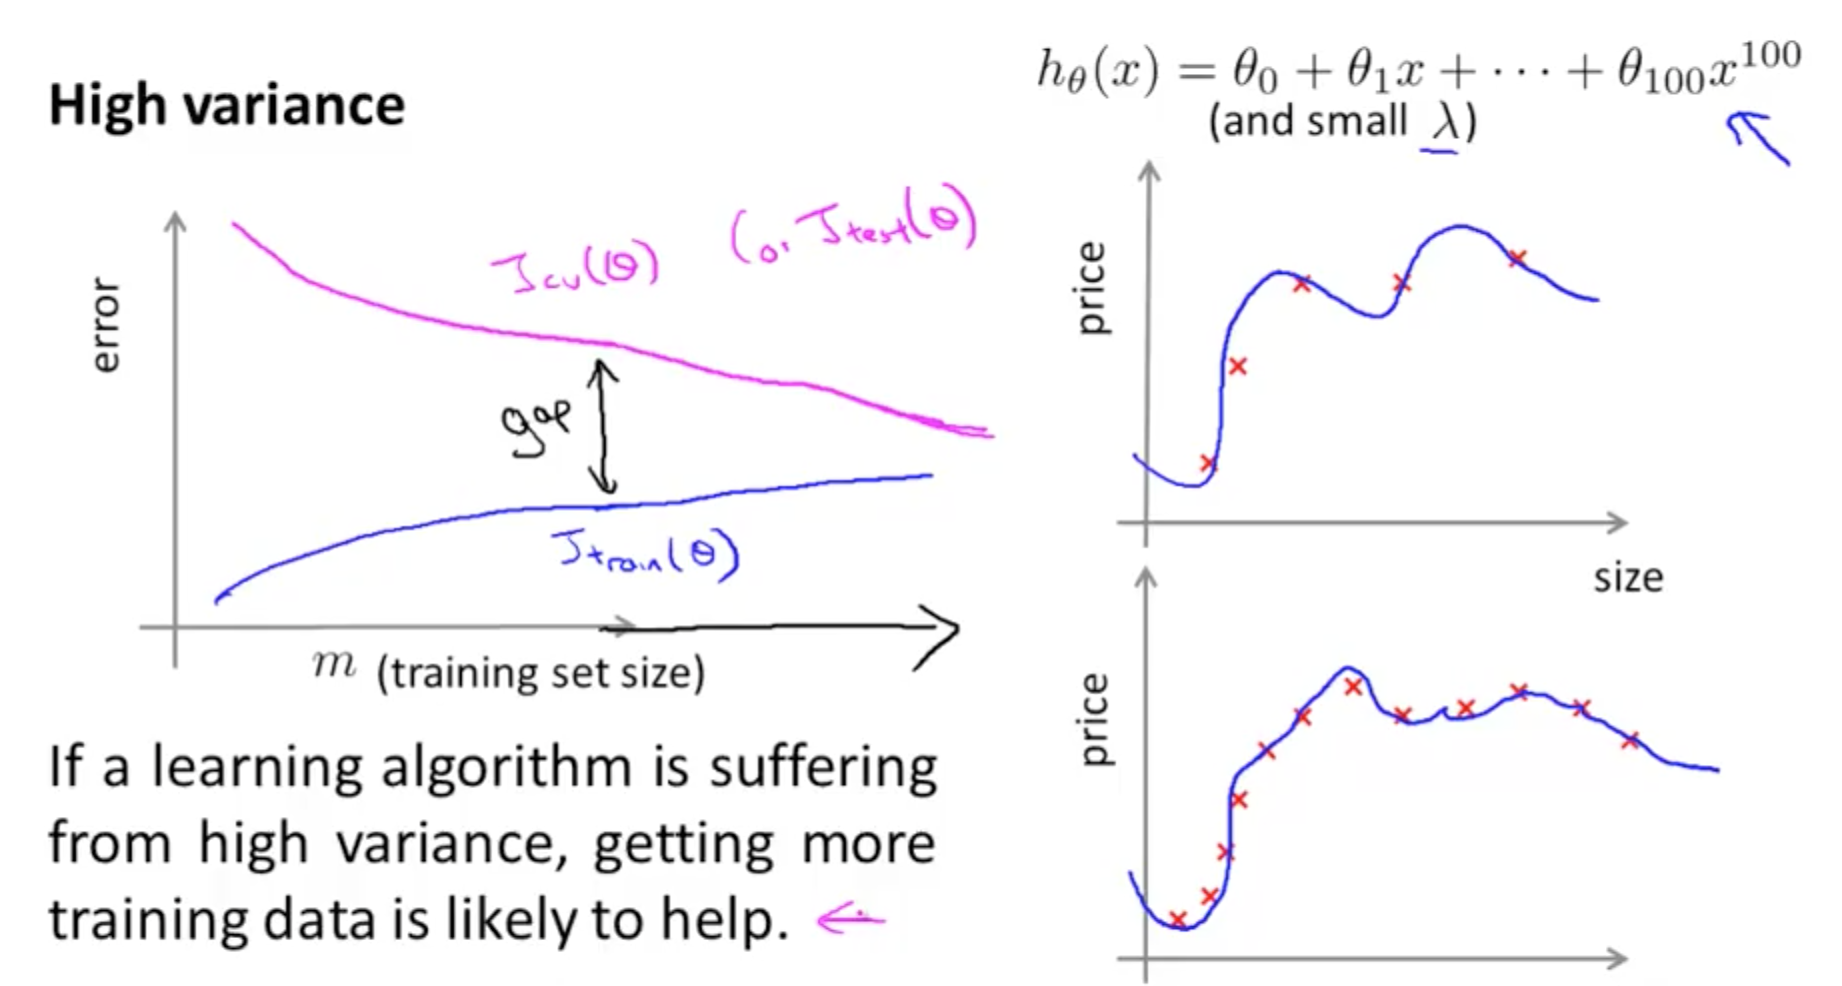
- and diagnosing problems such as overfitting (or underfitting).
Learning curves can also be tools for determining how much a model benefits from adding more training data, and whether the model suffers more from a variance error or a bias error. If both the validation score and the training score converge to a certain value, then the model will no longer significantly benefit from more training data.
Formal definition
When creating a function to approximate the distribution of some data, it is necessary to define a loss function to measure how good the model output is (e.g., accuracy for classification tasks or mean squared error for regression). We then define an optimization process which finds model parameters such that is minimized, referred to as .
Training curve for amount of data
If the training data is
and the validation data is
,
a learning curve is the plot of the two curves
where
Training curve for number of iterations
Many optimization algorithms are iterative, repeating the same step (such as backpropagation) until the process converges to an optimal value. Gradient descent is one such algorithm. If is the approximation of the optimal after steps, a learning curve is the plot of
See also
- Overfitting
- Bias–variance tradeoff
- Model selection
- Cross-validation (statistics)
- Validity (statistics)
- Verification and validation
- Double descent
References